Street trees are an integral part of street design as they contribute to the sense of enclosure, act as a buffer to traffic noise/pollution and enhance place. A traffic-calming effect can also be achieved, where trees are planted in continuous rows and their canopies overhang, at least in part, the vehicular carriageway. Design Manual for Urban Roads and Streets, p71 Dept. of Transport, Tourism and Sport. 2013.
The successful retention of suitable trees is a benchmark of sustainable development. Trees of good quality and condition are an asset to a site and significantly increase its attractiveness and value. They add a sense of character, maturity and provide valuable screening, shelter and privacy and will often have a useful life expectancy beyond the life of new buildings. Dublin City Tree Strategy 2018-2022.
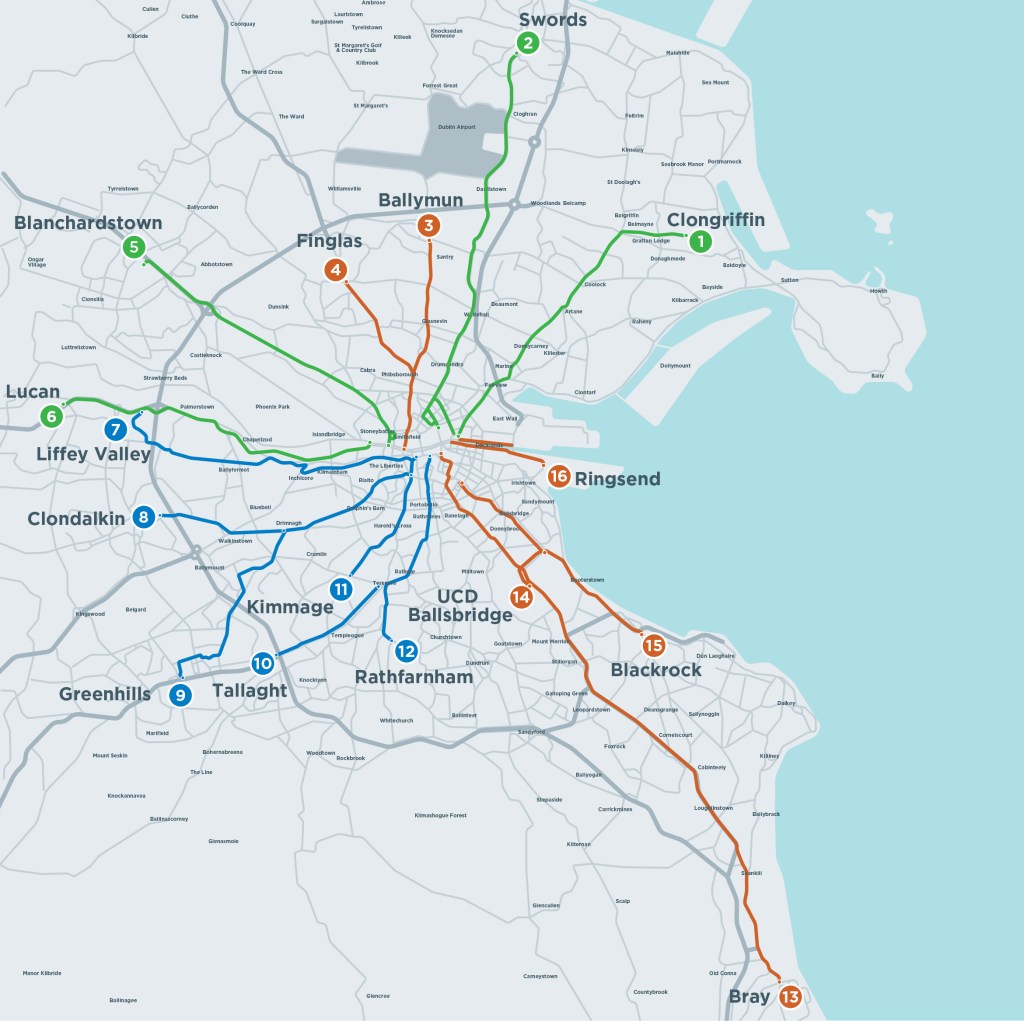
The core bus corridor project aims to deliver 230kms of dedicated bus lanes and 200kms of cycle tracks along 16 of the busiest corridors in Dublin. (www.busconnect.ie). The project involves road widening to relieve traffic congestion and the removal of trees as a consequence. There has been some discussion about the number of trees lost and the environmental impact. This short report examines the potential number of trees that may impacted by the bus corridors and the likely impact on environmental services (measured in terms of Carbon capture) and equivalent car numbers.
Analyses
The analysis here consists of two steps:
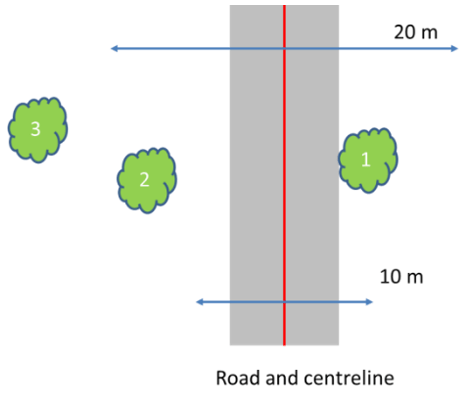
i) The number of trees along each corridor was estimated by placing the proposed bus routes over a satellite image. All the trees within a 20m and 10m zone around the road centreline were mapped; that is all trees within 10/5m of the road centreline on either side. These 20/10m widths were selected as representing the likely range of road widening based on a typical carriage lane width of 3.5 m (that is, 7 m from pavement to pavement). In the example, tree canopy 1 is inside the 10 and 20m zones, 2 is outside 10m and within 20m and, 3 is outside both zones.
ii) The environmental services provided by trees are extremely diverse and include hydrological management and biodiversity (see Dublin City Tree Strategy, 2016-2022). One service they provide is the ability to capture (sequester) and store Carbon. Carbon Dioxide (CO2) in the atmosphere is a Greenhouse Gas and is often present alongside other pollutants (NOx, PM10, etc.) that have the same source – on roads these are mostly vehicles. Carbon is captured annually (sequestered) by leaves and stored by trees (in the stem, branches and roots). The rate of sequestration and amount of storage depends on the size of the tree – larger (older) trees are far more effective than smaller and younger trees. We do not have measures of tree sizes along the corridors, so we estimated the Carbon services using data for 2500 street trees in Dublin city centre[1], which are quite diverse in terms of age and species. That study indicated that average tree stored 420kg and sequestered 17kg annually, which are the equivalent of 1541.4 kg and 62.4 kg of CO2, respectively.

[1] Tine Ningal, Gerald Mills & Pamela Smithwick (2010): An inventory of trees in Dublin city centre, Irish Geography, 43:2, 161-176. To link to this article: http://dx.doi.org/10.1080/00750778.2010.500525
Results
Figure 2 shows the distribution of trees within 10/20m of the road centrelines for each of the proposed routes. Table 1 shows the statistics associated with each route. The route with the largest number of trees is Clongriffin to the City Centre (Route 1), which has 713 and 134 trees in the 20m and 10m zones, respectively. However, the route with the largest number per km is Finglas to Phibsborough (Route 4). The total number of trees within the 20m zone is 4734 and 1000 within the 10m zone. The estimated CO2 stored within the 20 m zone is 7300 tonnes and the annual amount sequestered is 295 tonnes; the equivalent figures for the 10m zone are 1541 and 62 tonnes of CO2. We can translate these values into equivalent car numbers by:
- Estimating how much of the CO2 is emitted by cars along each route, that is, multiplying the length of route by the average CO2 emission per vehicle (130 g CO2/km) and assuming that each car makes this two-way trip every day of the year (370 trips).
- Calculate how many cars emit the quantity that the trees along each route store and sequester, that is, divide the result from step one into the CO2 values listed in Table 1.
Overall, the trees in the 20m zone store the car equivalent emissions of 8900 cars and capture the emissions of 363 cars annually; the equivalent values for trees in the 10 m zone are 1802 and 73 cars, respectively.


Conclusions
The trees along the proposed bus corridors currently provide extremely valuable environmental services that include biodiversity, rainwater management and air quality. Street trees also provide well-established economic, social and health benefits to neighbourhoods. Not surprisingly, tree planting is a core part of city greening plans globally.
The existing tree stock along the identified routes is diverse in terms of age and species and has provided these services over a very long time. Moreover, the value of these services will increase over time if the tree stock is managed. Young trees do a fraction of the work of mature trees so replacing mature larger trees with saplings will greatly diminish the existing resource. Replacing mature trees with equivalent trees in other locations removes the benefits to another place and will require a considerable investment (tree cost, planting cost and site acquisition).
At the least, a full environmental impact analysis of the existing tree stock that may be lost in the corridor project is needed; this should account for the existing and future benefits of these trees (for those that live along these corridors) and the full remediation costs.

The proposed Bus Connects bus routes and the trees within 20m zone centred of the road centrelines. The table shows the length of route, the number of trees within the 20m and 10m zones, the estimated amount of Carbon stored and the equivalent number of cars. The car estimate is based on the emissions of a typical car completing each bus route into and out of the city 365 days a year.
This assessment was published by the Irish Independent on Sunday 16 June 2019 and UCD Media Unit; a PDF version can be found here.
